I'm Building an Engine That Tests Trading Ideas So You Don’t Have To
Most trading indicators are sold on vibes. Someone posts a chart with green arrows pointing up, slaps a 79% win rate on it, and asks for $49 a month.
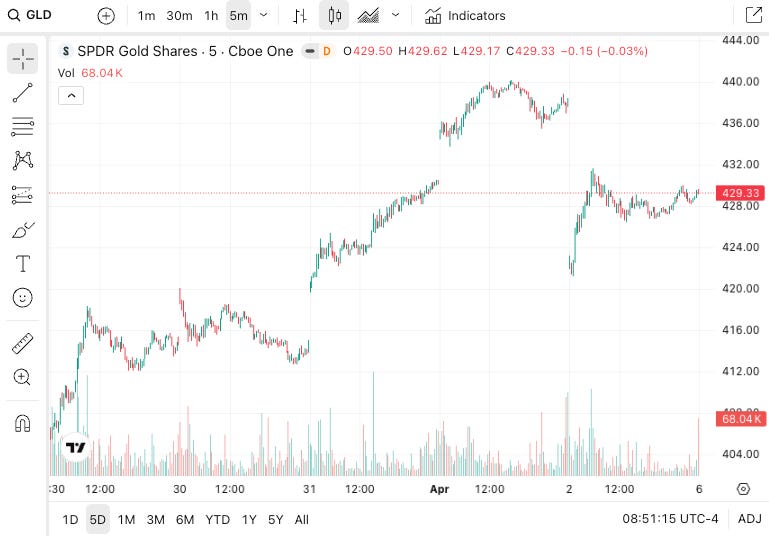
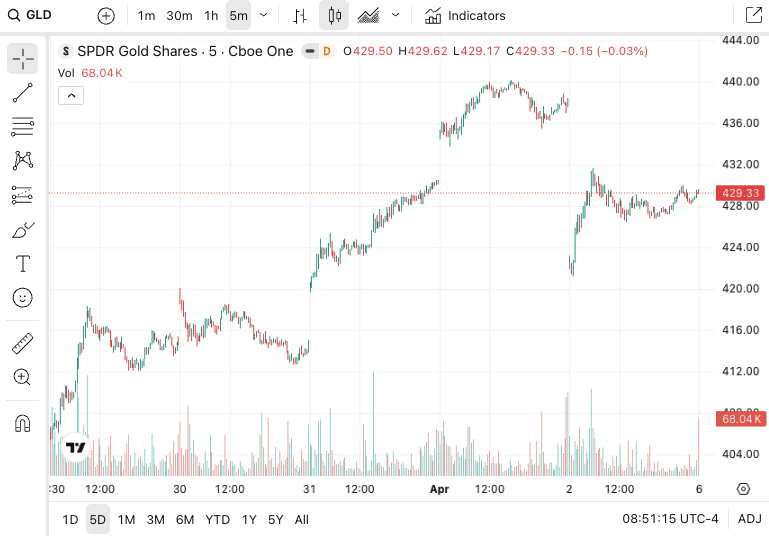
Or, they look something like this…
")
You have no idea how they tested it. You have no idea if they tested it. And if you’re being honest with yourself, you’ve probably bought one of these at some point and quietly stopped using it a few weeks later.
I think the indicator market deserves better than that so I’m building something different.
The Problem With Most Indicators
Here’s how most trading indicators get made. Someone notices a pattern on a chart. They code it up, tweak the settings until the backtest looks amazing, and then sell it.
The issue is that this process almost guarantees the thing won’t work going forward. When you optimize parameters until the historical results look perfect, you’re not discovering an edge. You’re memorizing noise. It’s like studying only the answer key before an exam and being surprised when the questions change.
The financial world has a name for this: overfitting.
The more parameters you tune, the worse it gets. That “79% win rate” likely came from a single backtest run on a single time period with settings specifically chosen to produce that number. Run it on new data and the magic disappears.
What’s usually missing is the part nobody wants to do. The boring part. The part where you ask: why should this pattern exist in the first place? What structural behavior in the market creates it? And does it hold up when you deliberately try to break it?
What I’m Actually Building
After considerable research coupled with the right hardware, I built a structured framework for generating, validating, and either killing or shipping trading indicator ideas. The idea is to build a pipeline that connects several pieces together, and it runs largely on its own once an idea enters the system.
It starts with hypothesis generation.
We maintain a registry of over 60 testable ideas spanning equities, volatility, and Bitcoin. These come from academic research papers, market microstructure analysis, and our own observations about structural behaviors in liquid markets like SPY, QQQ, NQ futures, and BTC.
With Claude Code, I also built a literature scanner that ingests new research papers from academic databases and flags the ones worth investigating. This way, the pipeline isn’t static and new ideas flow in continuously.
I love me a good flywheel effect!
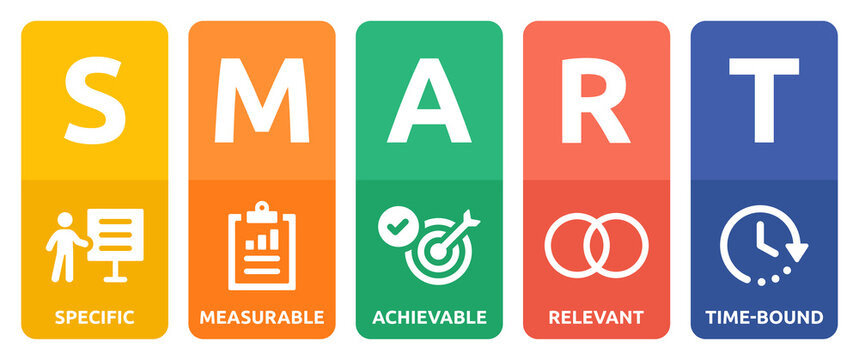
SMART Goals Before Any Data Gets Touched
Before any idea touches a single data point, it has to clear what we call a SMART goal review. If you’re not familiar, SMART stands for Specific, Measurable, Achievable, Relevant, and Time-Bound.
It’s a framework that’s been used in business planning for decades and it adapts well for intentional trading strategy research.
Here’s what that means in practice. For every idea that enters the pipeline, we write down exactly what we’re testing, what data we need, what success looks like, and what would make us kill the idea immediately. All before we run a single backtest.
Think of it as a pre-commitment device. You write down the rules before you see the results, not after. This prevents something researchers call “p-hacking,” which is just a fancy way of saying you keep testing until something looks good and then pretend that was the plan all along.
The idea also needs a written economic rationale.
You have to explain why this pattern should exist. Not “it just works.” Not “the RSI crossed below 30.” You need a structural explanation tied to actual market behavior.
Think institutional rebalancing flows, options expiration mechanics, or funding rate dynamics in crypto futures. If you can’t write that paragraph, the idea doesn’t move forward.
The Four Gates
Ideas that pass the initial SMART review enter our autoresearch loop. This is where the dedicated hardware comes in. We’ve procured a Mac Studio specifically built for this purpose, and it’ll run automated backtesting pipelines that test hundreds of parameter variations for each idea across multiple market conditions.
But raw backtesting isn’t the point. The point is what happens after.
Every idea has to survive four gates before we’d ever consider turning it into a product.
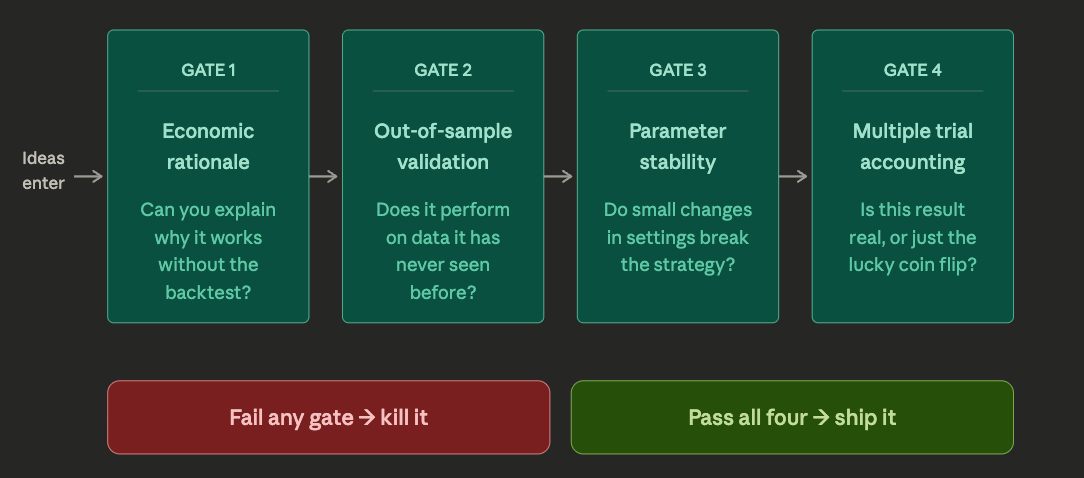
Gate 1: Economic Rationale. Can we explain why this works without referencing the backtest? This is the “so what” test. If the only argument for a strategy is “look at the returns,” it’s dead on arrival. There has to be a reason rooted in how markets actually function. Maybe it exploits a predictable behavior around options expiration. Maybe it captures a liquidity imbalance at the open. Whatever it is, it has to make sense on paper before the numbers matter.
Gate 2: Out-of-Sample Validation. We split the data so the model never sees the test period during development. Think of it like a teacher grading you on questions you haven’t studied. If performance drops significantly on unseen data, the strategy was probably just memorizing the historical answer key. Kill it.
Gate 3: Parameter Stability. We take the “best” settings and shift them by 20% in every direction. If small changes break the strategy, those original settings were just lucky. A real edge shows graceful degradation. Performance declines gradually, not off a cliff. If there’s one narrow configuration that works and everything around it fails, the model hasn’t learned anything transferable.
Gate 4: Multiple Trial Accounting. This is the one most people skip, and it might be the most important. Here’s the simple version: if you test 200 ideas and one of them looks great, that might just be the coin flip that happened to land on heads.
Gate 4 asks a straightforward question: given how many total experiments we’ve run, is this result still statistically meaningful? It’s an honest accounting of how many attempts it took to find this result. Most ideas that look impressive in isolation look a lot less impressive when you account for all the ideas that were tested alongside them.
Most ideas die at these gates which is the entire point.
Here’s Where It Gets Interesting…
The entire system will be orchestrated by specialized AI agents, each responsible for a specific task in the pipeline.
Agent 1 researches for new trading ideas.
Agent 2 handles data preparation.
Agent 3 runs the parameter sweeps.
Agent 4 evaluates the gate criteria.
Agent 5 review and confirms output with Agent 4
Agent 6 generates the content writeups
Agent 7 transcribes the output into pinescript code that can be packaged as the indicator
They hand work to each other in sequence, and each one verifies the output of the one before it.
This isn’t a chatbot answering questions about trading. It’s a coordinated workflow where AI handles the repetitive, compute-heavy work, and the human (me) focuses on judgment calls: which ideas to prioritize, which rationales are convincing, and which results are genuinely surprising versus which ones are just noise that survived the filter.
And because the pipeline generates ideas continuously, there’s no shortage of things to test. The bottleneck was never ideas. It was rigor. That’s what this system is designed to solve.
Why This Matters For You
The indicators that survive this process will be available through our marketplace. They’ll cover the instruments most active traders actually use: SPY, QQQ, NQ futures, and Bitcoin. Each one will ship with something you almost never see from indicator sellers: a full transparency page showing out-of-sample performance, parameter stability results, and the total number of ideas we tested to find it.
That last part matters more than people realize. If someone shows you one winning strategy but doesn’t tell you how many they tested to find it, the result might not mean what you think it means. We’re going to show you the full picture, including the failures.
And the ideas that fail? We’ll publish those too. Because knowing what doesn’t work is just as valuable as knowing what does. Maybe more so.
The benefit for you is straightforward. Instead of buying indicators from someone you don’t know, built on a process you can’t see, you get strategies backed by a framework you can evaluate. Rigorously tested on the most liquid instruments in the market. With full documentation of the methodology, every step of the way.
The first indicators are on track to ship this quarter. We’ll be sharing the research, the kills, and the process along the way.
If you’re tired of buying indicators built on vibes and tested on hope, this is what rigor actually looks like. And as a subscriber to BitFinance, we have much more in store for you to continue providing education and value.
Moving on…
This Week in 2 Minutes

5 Lessons Backtesting Taught Me That Every Investor Should Demand From Their Fund Manager (Mar 31)
Most trading strategies are sold on the strength of their backtest.
The problem is that a good backtest is easy to manufacture and hard to see through without the right questions. We broke down the five biggest red flags we’ve caught building the Buffett Bot, including why training accuracy means almost nothing, how a beautiful equity curve can lie, and why the most important test is whether someone can explain their edge in plain language.
Each lesson came with a specific question you can ask any fund manager, strategy provider, or advisor running systematic money.
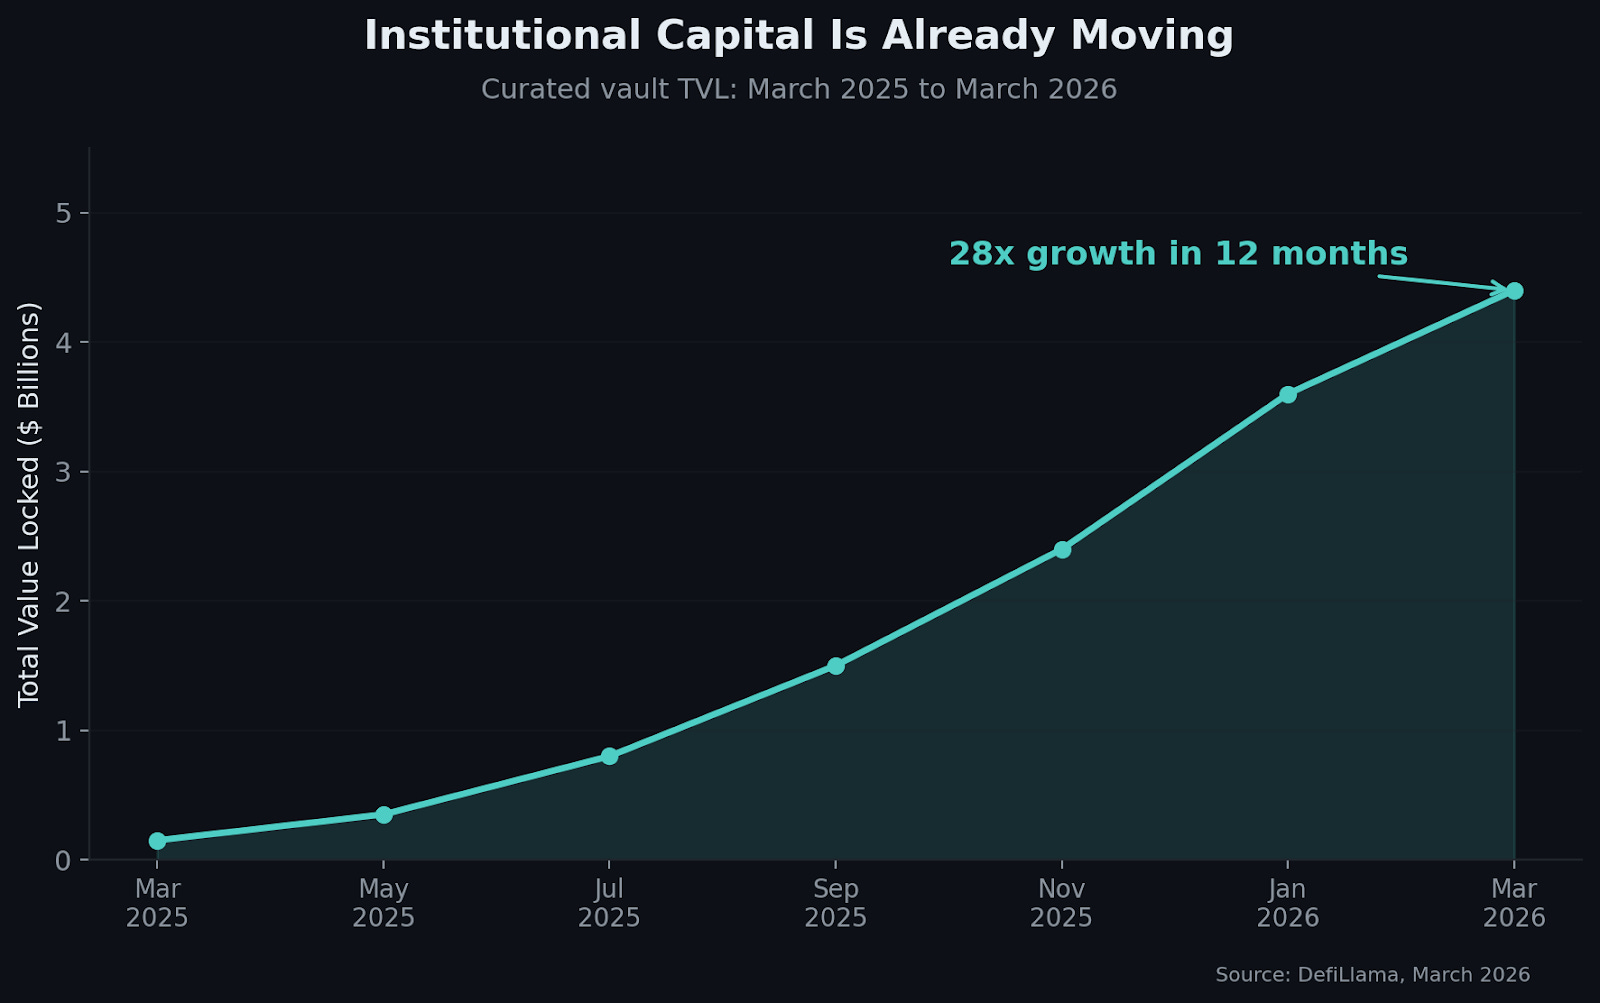
$4.4 Billion in 12 Months. The Investment Vehicle You Haven’t Heard Of (Yet!) (Apr 2)
Curated onchain vaults grew 28x in the past year, and the names behind them aren’t startups. Bitwise, Kraken, Apollo, and Fidelity are all building on this infrastructure.
We walked through what vaults actually change for advisors and allocators: real-time transparency, direct capital control, and yield sources you can verify onchain instead of trusting a quarterly statement.
We also covered the four vault categories that matter (yield, RWA-backed, delta-neutral, and leveraged) and the risks that come with each, including smart contract vulnerabilities, curator concentration, and regulatory uncertainty.
WINNERS 🏆
Week of April 4
U.S. equities snapped a five-week losing streak. The S&P 500 gained 3.4% on the holiday-shortened week, posting its best single day since May on Tuesday. The Nasdaq climbed 4.4% and the Dow added nearly 3%. The rally came on retreating oil prices mid-week and renewed hope that the Iran conflict could move toward de-escalation. It wasn’t smooth. Thursday saw a 600-point intraday swing on the Dow before a late recovery on Iran-Oman Strait of Hormuz monitoring news. But for the first time in over a month, stocks closed the week higher. That means something, even if the path there was messy.
Gold. Back above $4,698, up about 4% on the week. The safe-haven trade continues to work exactly as advertised. Gold has been one of the most consistent performers of 2026, and geopolitical uncertainty isn’t going anywhere. With oil elevated and the Fed boxed in, the macro setup for gold remains intact.
March jobs report. The economy added 178,000 jobs in March, beating every estimate in the Bloomberg survey. Unemployment dipped to 4.3%. The report dropped on Good Friday while markets were closed, but the signal is clear: the labor market hasn’t cracked despite five weeks of war and oil above $100. This buys the Fed time and gives bulls something to point to. Whether it’s enough to offset the inflation pressure from energy is the real question.
Palantir (PLTR). Up 4% on the week as AI defense contracts and commercial growth continued to drive institutional interest. In a market where most tech is struggling for a narrative, Palantir’s position at the intersection of AI and defense spending gives it a rare macro tailwind. One of the few names benefiting from the geopolitical backdrop rather than fighting against it.
LOSERS 📉
Oil. Yes, the price is up. The problem is what it’s doing to everything else. WTI crude surged 12% on the week to $111.56 after Trump’s Wednesday address vowing to continue the Iran campaign for two to three more weeks. When the president says he’s going to bring a country “back to the stone ages,” oil traders listen. Brent briefly touched $113. At these levels, the inflation math changes for consumers, corporations, and the Fed. The oil rally is a winner for energy producers and a loser for basically everyone else…especially if you like driving cars.

Tesla (TSLA). Down more than 5% on Thursday alone after first-quarter deliveries came in at 358,023, missing the consensus range of 364,000 to 372,000. This continues a pattern of delivery misses that raise questions about demand rather than production. The stock has been one of the worst large-cap performers of 2026.
Bitcoin. Dropped from around $68,000 to roughly $66,900 over the course of the week, a 2-3% decline. The Fear & Greed Index sits at 9, which is extreme fear territory. BTC is now down roughly 45% from its late-2025 highs. Goldman Sachs put out a note suggesting the bottom may be near, and Bitcoin dominance is holding at 56-58%, meaning capital is consolidating into BTC while alts continue to bleed. The setup could be a springboard or a trapdoor. What happens with oil and the Fed over the next two weeks will likely decide which one.
Consumer confidence. The Michigan Sentiment reading continued to deteriorate, and the OECD raised its U.S. inflation forecast to 4.2% for 2026, up from 2.6%. When the organization tracking global economic health doubles its inflation estimate for the world’s largest economy, that’s not noise. It’s a signal that the war’s economic effects are being priced into the structural outlook, not just the weekly tape.
ON DECK: 3 THINGS TO WATCH NEXT WEEK
Week of April 6
March CPI (Friday, April 10). This is the number that matters most right now. Oil has surged roughly 60% since the Iran conflict began. The question is how much of that has filtered through into the headline and core inflation readings. A hot CPI print could push rate cut expectations further out and pressure both equities and crypto. A tame reading would suggest the energy spike hasn’t fully transmitted yet, giving the Fed more room to maneuver. Either way, this print sets the tone for the April 28-29 FOMC meeting
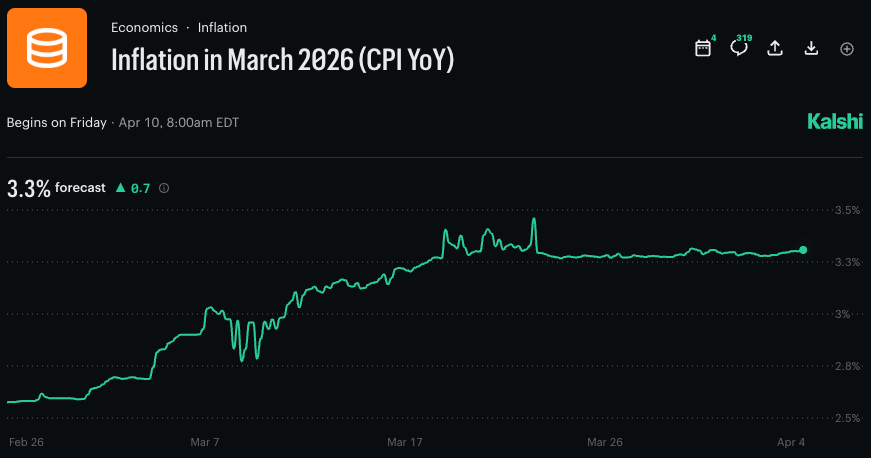
.
FOMC Minutes (Wednesday, April 8). The minutes from the March 17-18 meeting land mid-week. Markets will be parsing every sentence for how the Fed is thinking about energy-driven inflation versus growth concerns. Remember, the March meeting happened when oil was already elevated but before Trump’s latest escalation. Any language suggesting the Fed is leaning toward holding rates despite weakening data would confirm the stagflation concern that’s been building all quarter. Watch for the word “patient.” If you see it, risk assets won’t like it.
Iran Timeline and Oil’s Next Move. Trump told the nation the military campaign will continue for two to three more weeks. That puts a potential resolution window somewhere around mid-to-late April. Markets have been whipsawing on every headline. Iran and Oman are reportedly drafting a Strait of Hormuz monitoring protocol, but it’s unclear whether that satisfies U.S. demands. If oil breaks above $115, the stagflation narrative goes from whisper to headline. If diplomatic progress emerges and crude pulls back toward $95-100, expect a sharp relief rally across risk assets, including crypto. This remains the single most important variable in every market right now.

Matthew Snider is the founder of Block3 Strategy Group, author of “Warren Buffett in a Web3 World,” and publisher of the BitFinance newsletter. He holds a Series 65 and MBA, and has been an active participant in digital asset markets since 2015. This article is for educational purposes only and should not be considered financial advice. Always consult with a qualified professional before making investment decisions.