I Let an AI Run 4,300 Weather Experiments While I Slept. Here's What It Found.

I’m not a programmer.
I’m a finance nerd with fiduciary investment responsibilities (and decent golf swing!) who builds everything with Claude Code. Right now, I have 3 automated jobs running on my dedicated Mac Mini trying to get better at predicting the weather without any help from me.
That may sound like a strange hobby, but it’s actually a sandbox for something much bigger.
The Concept: Karpathy’s Autoresearch Loop
In March 2026, Andrej Karpathy open-sourced a concept called the autoresearch loop. Strip away the academic framing and it’s elegantly simple:
The Loop
Human writes a research objective once
AI agent proposes a change
Agent runs the experiment
Agent measures the result against a clean metric
If better: keep. If worse: revert. Log everything.
Repeat forever, unsupervised.
Karpathy applied this to machine learning training.

The chart above is from Karpathy’s actual autoresearch run. Each dot is a complete experiment.
The gray dots are failures.
The green dots are the ones that improved the score.
Out of 276 experiments, only 29 made the cut.
That green staircase line trending downward? That’s the system getting better over time, one small improvement at a time, without a human touching anything.
The gray dots (failures) are what makes the green dots (successes) trustworthy. If you only showed me the 29 winners, I’d have no way to know whether you got lucky or found something real. The fact that 247 experiments failed and were logged honestly is what gives the 29 survivors their credibility.
The insight that stuck with me: it’s not a smarter agent. It’s a tighter loop with a clean metric. Intelligence compounds from iteration speed, not from any individual experiment being clever.
I wanted to know if the same pattern could work outside of ML. So I pointed it at something with daily feedback, publicly verifiable outcomes, and enough structure to tell me quickly whether the approach was worth scaling.
The Sandbox: Weather Markets on Kalshi
Here’s what’s running right now, fully hands-off.
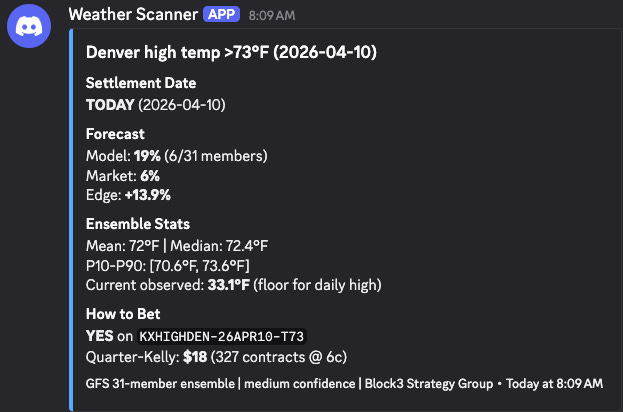
A weather scanner pulls 31-member forecasts every hour for six US cities. It computes probability distributions for each temperature bracket Kalshi offers, compares those probabilities against market-implied prices, flags edges above an 8% threshold, and fires Discord alerts with position sizing recommendations.
Every morning at 10:30 AM, a separate scoring job fetches National Weather Service verified actuals and grades yesterday’s predictions. How far off was the forecast? Did the ensemble’s confidence interval capture the actual temperature? Which cities are the model’s blind spots?
And once a week on Sunday, the autoresearch engine activates. It grid-searches roughly 4,300 bias correction variations across multiple dimensions: per-city adjustments, global corrections, ensemble member weighting, different rounding strategies. Each variation gets replayed against the full history. Each one gets scored. Each one gets logged.
The two gates for promotion are simple: The winning variation has to beat the uncorrected model by more than 1%.
And its cross-validated score has to be stable, not fragile. If both gates clear, the system writes a new calibration file. The hourly scanner picks it up automatically on its next run. If neither gate clears, nothing changes. The raw ensemble remains the safe default.
Early Results: Honest Assessment
We’re early. 5 days of predictions, one scored well. But early data is still data.
The good: Miami showed a genuine edge. The model put 90.7% probability on a specific temperature bracket that the market priced at 62.5%. Austin’s predictions landed within the ensemble’s confidence interval.
The honest: Mean absolute error across all cities was 3.7 degrees. Only 1 of 6 cities had actuals within the ensemble’s P10-P90 range. Chicago was 10 degrees off. The model has city-level biases that need exactly the kind of correction the autoresearch loop is designed to find.
The suspicious: Some edges showed 30%+ gaps. That’s not an edge. That’s thin liquidity, stale prices, or uncalibrated probabilities. The 8-10% edges that actually triggered alerts are more believable.
This is exactly why you collect data before you bet.
First meaningful autoresearch run: late April, once we have 10+ scored days.
By mid-May, we’ll know whether city-level bias correction meaningfully improves edge detection or whether weather markets are too efficient for this approach.
Either answer is valuable. The point isn’t to get rich on weather bets it’s to validate our process for building the validation loop for waht comes next!
Where This Actually Goes
The weather experiment is a sandbox. The architecture we’re validating is identical to what we’re building for our fund’s quantitative indicator pipeline.
Same loop. Different inputs.
Instead of temperature forecasts, the agent tests trading indicators. Instead of weather actuals, it scores against out-of-sample market data. Instead of 4,300 bias corrections, it searches parameter variations on BTC funding rates, equity volatility surfaces, and options pricing models.
On a Mac Studio (arriving soon!!), each backtesting iteration takes about 4-5 minutes. That’s roughly 280 experiments per day, running unsupervised overnight. The weather sandbox, where each trial takes less than a second, lets us debug the plumbing before the stakes get real.
The Part Most People Skip
Here’s why I think this approach is different from most retail quant operations. Many folks focus on just the AI and generated results. They don’t necessarily look at the accounting behind the process.
In our case, every trial gets logged to what we call the Strategy Registry to determine winners and losers. Every parameter combination, every score, every outcome gets measured and accounted for. In my recent research of machine learning, I’ve come to realize this isn’t optional; it’s the foundation of honest performance evaluation.
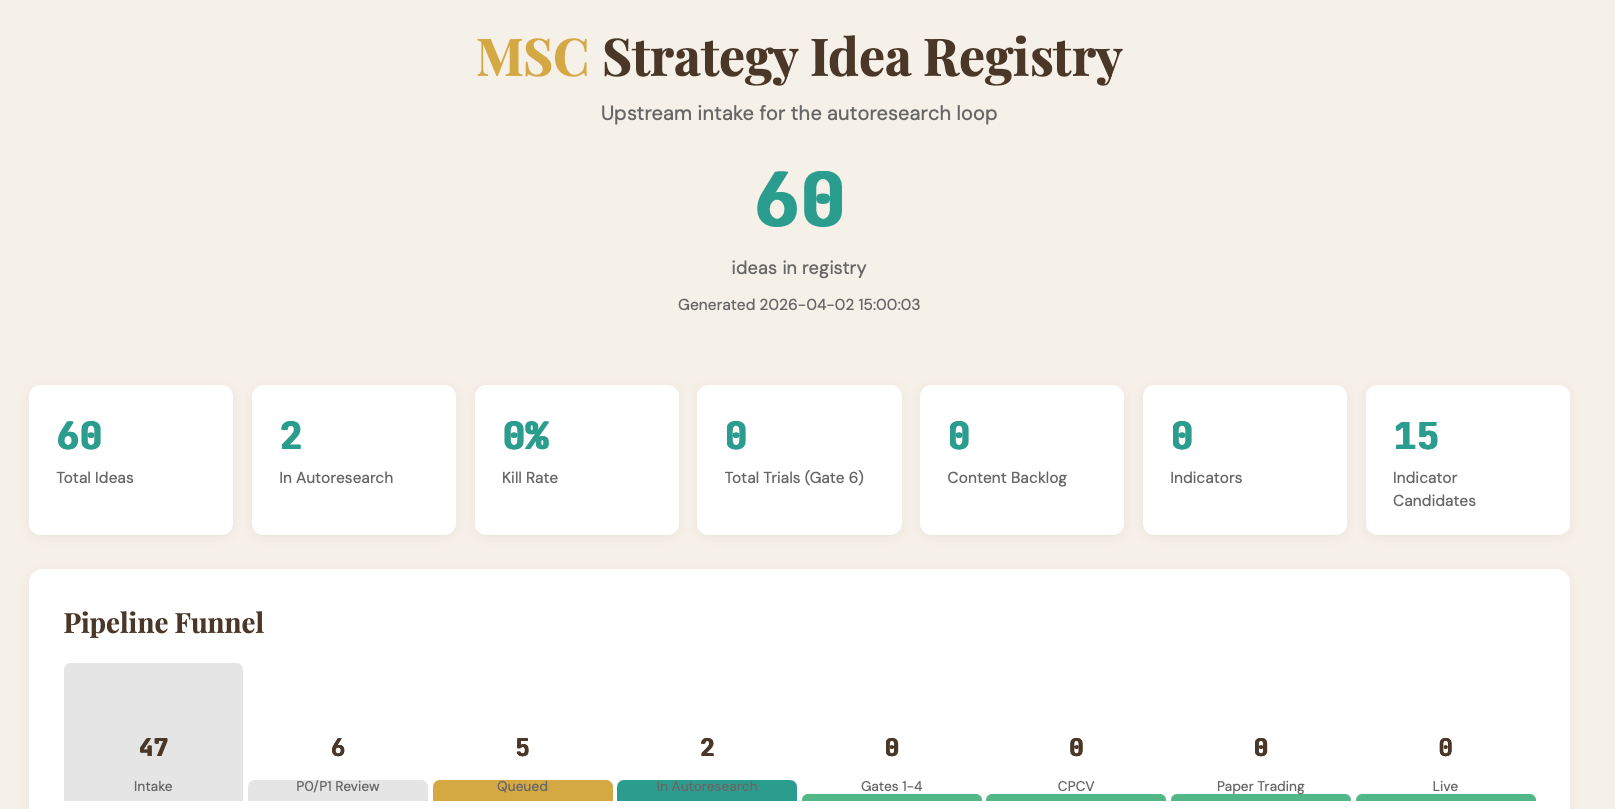
If you test 100 parameter combinations and show me the best one, that performance metric is inflated by selection bias. You got lucky across 100 coin flips and you’re showing me the best flip. The only way to correct for this is to account for every flip you took. That’s what the trial registry does and the autoresearch loop populates it automatically.
Most quant operations fail because they overfit to historical data, they don’t log their failures, or they iterate too slowly for systematic search to work. The loop addresses all three. The validation gates prevent overfitting. The registry makes selection bias visible. And automated experimentation removes the human bottleneck entirely.
The bet we’re making is simple: build the loop right, and the strategies take care of themselves. The human writes the objective and the constraints. The machine grinds the parameter space. The data picks the winner. And the registry keeps everyone honest.
I’ll keep sharing what we find. Including the failures. Especially the failures.
Moving right along…
This Week in 2 Minutes
The Results Are In: What I Learned Putting Real Money Behind an AI-Powered March Madness Model (April 7)
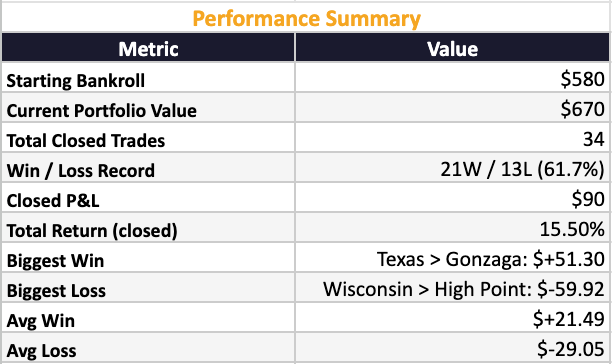
We put $580 of real capital behind a systematic prediction market strategy on Kalshi using KenPom efficiency ratings and quarter-Kelly sizing. The system went 22-15 with a 61.7% win rate and a 15.5% return on bankroll.
The early rounds were profitable. The later rounds taught harder lessons, including a Duke-UConn game where $97 of profit evaporated on a half-court buzzer beater.
The biggest takeaway wasn't the P&L. It was understanding where edge actually lives, why it disappears as markets get efficient, and why knowing when not to bet is the most underrated skill in any market.
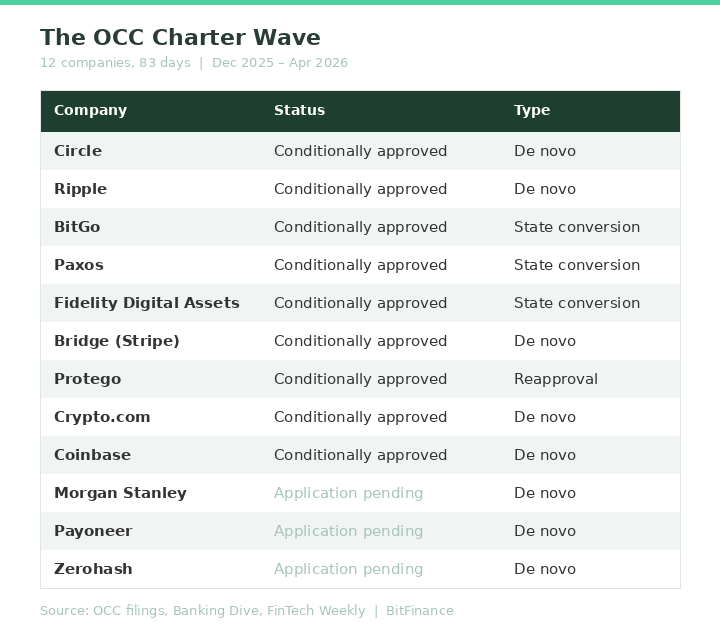
12 Companies, 83 Days: The Digital Asset Custody Monopoly Is Over (April 10)
Anchorage Digital held the only federal crypto bank charter for five years.
Between December and April, twelve companies filed for or received the same charter. Circle, Fidelity, Coinbase, Morgan Stanley, and more.
We break down what the charter actually gives them, why the "not your keys, not your crypto" argument just got weaker, and three questions every advisor should ask before choosing a custodian.
Winners This Week 🏆
The ceasefire rally. The S&P 500 posted its best week since November, gaining over 3% after Trump suspended attacks on Iran for two weeks. The Dow turned positive for 2026 after a 10% correction just two weeks ago. The Nasdaq climbed roughly 4%. The catalyst was straightforward: Pakistan brokered a ceasefire proposal, Trump accepted, and risk assets ripped. Whether it holds is a different question entirely.
Bitcoin. Back above $73,000 (yay!) after touching intraday highs near $73,480. Up roughly 7% on the week as institutional inflows accelerated and the ceasefire eased the macro pressure. Morgan Stanley launched its Bitcoin Trust (MSBT) this week, and Bitcoin dominance continues holding at 56-58%. The Fear & Greed Index has climbed out of extreme fear territory. Still down meaningfully from late-2025 highs, but the direction shifted.
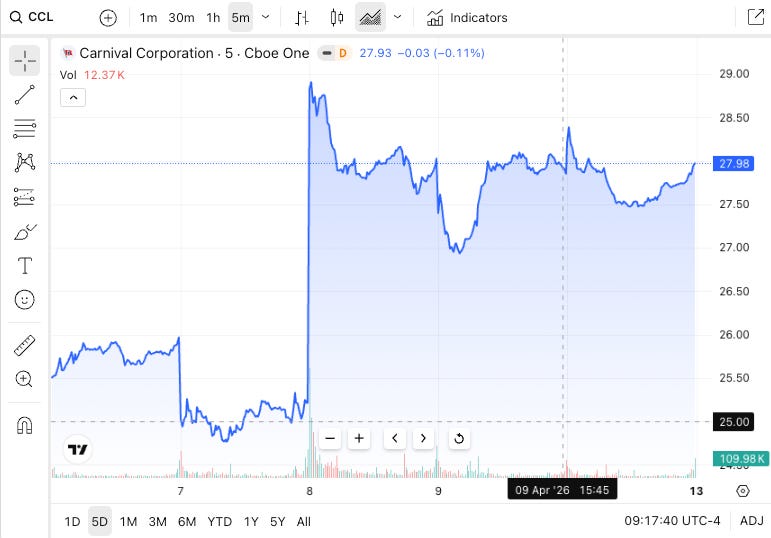
Carnival (CCL). Up 10% on the week after the ceasefire reopened the cruise trade. The stock had dropped 20% from the start of the war to the ceasefire announcement. Strong Q1 earnings helped, but this was really about the Strait of Hormuz reopening and travel stocks catching a bid.
Losers This Week 📉
Gold. Pulled back from recent highs to around $4,787, down roughly 0.6% on Friday. The ceasefire trade is the opposite of the safe-haven trade. Gold has been one of the best performers of 2026, but when risk appetite returns, the flight-to-safety bid fades. If the ceasefire holds, expect continued pressure. If it doesn’t, gold will remind everyone why it’s in the portfolio.
Apple (AAPL). Down nearly 4% on Tuesday after reports of engineering setbacks on its foldable iPhone. Bloomberg later said the September launch is still on track, but the damage was done for the week. In a market where every Mag 7 name is fighting for narrative, production uncertainty isn’t what investors wanted to hear.

March CPI. Headline inflation came in at 3.3%. Not terrible, but not the number the Fed needed to justify cuts. With oil still elevated (even post-ceasefire), the energy passthrough into broader inflation remains the key variable. The Fed is boxed in: rates stay higher for longer unless oil comes down and stays down.

What’s on Deck for April 13th
Big bank earnings. Goldman Sachs kicks it off Monday. JPMorgan, Citigroup, Wells Fargo, and BlackRock report Tuesday. Morgan Stanley and Bank of America on Wednesday. This is the first real look at how six weeks of war, $100+ oil, and elevated rates have impacted trading revenue, loan loss provisions, and forward guidance. Watch the commentary on credit quality more than the headline numbers. If banks are building reserves, they’re seeing something in the data that hasn’t shown up in the macro prints yet.
March PPI (Tuesday). The producer price index lands the day before import/export prices. CPI already came in at 3.3%. If PPI confirms that input costs are rising faster than consumer prices, that’s a margin squeeze story for Q2 earnings across the board. Energy is the variable. How much of the oil spike has filtered through the supply chain will set the tone for the rest of earnings season.
Ceasefire durability. The two-week window expires around April 22. The Strait of Hormuz is reportedly operating at only 7% of normal capacity despite the ceasefire agreement. If Iran fully reopens the strait, oil could pull back toward $85-90 and risk assets extend the rally. If the deal breaks down, we’re back to $115+ crude and everything that comes with it. This remains the single most important variable in every market. Everything else is noise until this resolves.
Matthew Snider is the founder of Block3 Strategy Group, author of “Warren Buffett in a Web3 World,” and publisher of the BitFinance newsletter. He holds a Series 65 and MBA, and has been an active participant in digital asset markets since 2015. This article is for educational purposes only and should not be considered financial advice. Always consult with a qualified professional before making investment decisions.