How to Build a Bot That Finds Mispricings in Prediction Markets
Kalshi’s March Madness prediction markets are full of recreational bettors whose pricing reflects feelings, not fundamentals. We built a system that finds the gaps.
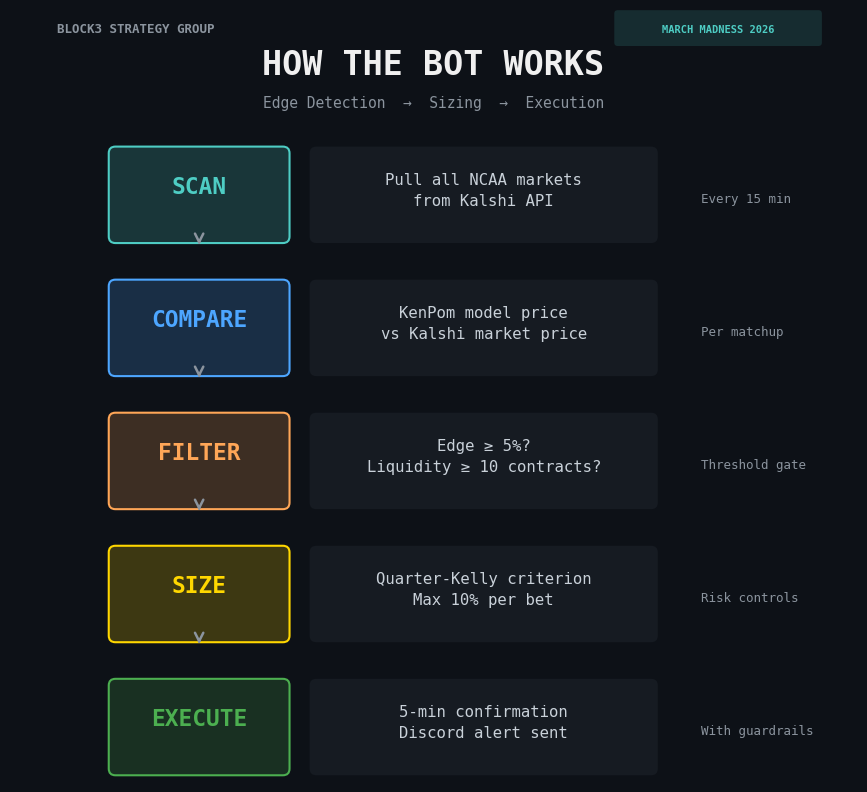
This week, using Claude Code and zero prior coding experience, I built a trading bot that scans Kalshi’s tournament markets every 15 minutes, compares their prices to a statistical model, identifies edges, sizes positions conservatively, and sends alerts to Discord. Then we added a halftime scanner that catches panic-selling in real time.
The bot is live. The bankroll is $580. Here’s how it works.
But first a disclaimer:
THIS IS AN EXPERIMENT. I HAVE NO IDEA IF THIS WILL ACTUALLY WORK OR BE PROFITABLE. READ, PLAN, AND TRADE ACCORDINGLY.
How the Bot Finds Edges and Communicates
Every NCAA team has a KenPom efficiency rating that measures how good they actually are, adjusted for schedule strength and pace. We convert the gap between two teams’ ratings into a win probability. That’s the model price.
The bot compares that model price to what Kalshi’s market is actually charging at daily intervals. When the gap exceeds 5%, it flags a trade. If our model says Wisconsin wins 95.8% of the time and Kalshi has them at 81%, that’s a 14.8-point edge. The bot sees it, sizes it, and sends an alert.
The model doesn’t need to be right about every game. It needs to be more right than the market’s price, on average, across enough trades for the math to work. The tournament gives us 63 games plus 63 halftime windows. That’s 126 chances.
But efficiency ratings alone don’t capture everything. KenPom’s numbers are backward-looking. They tell you how good a team has been. They don’t automatically adjust for who’s actually suiting up on Thursday.
So we added an injury layer.
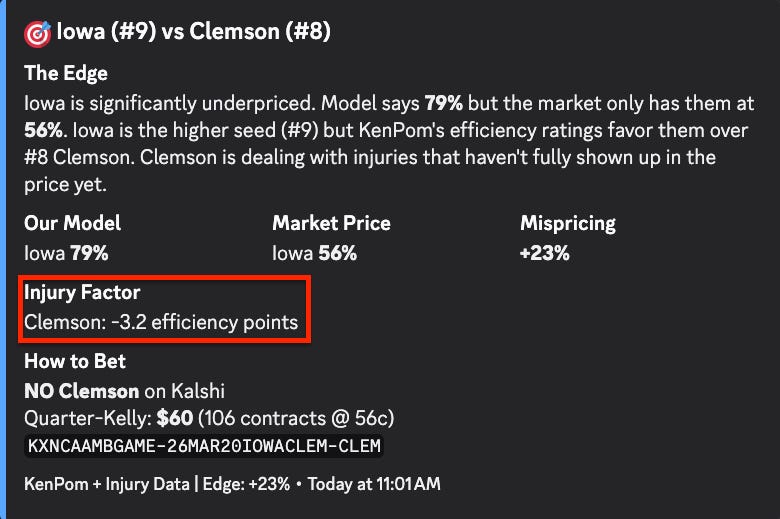
The model pulls real-time injury data from boydsbets.com and translates it into AdjEM adjustments. Each injured player gets weighted by role and status. Rotation players cost -1.5 AdjEM. Guards cost -2.0, reflecting their outsized impact on ball-handling and scoring in college basketball. Star players and leading scorers cost -3.5. Those base impacts then get discounted by availability: Out at full weight, Doubtful at 75%, Questionable at 40%, Probable at 10%.
There’s a catch, though. If a player suffered a season-ending injury before February, KenPom’s ratings have already absorbed the impact. Those guys don’t get double-counted. And the total adjustment is capped at -8 AdjEM to prevent a catastrophic injury report from completely flipping a strong team’s projection. You don’t want one bad MRI turning Duke into a coin flip.
The whole thing feeds directly into the Log5 win probability calculation. And this is where it gets interesting from an edge perspective. Injury news breaks at unpredictable times. A starter goes down in the final practice before the tournament and the market doesn’t fully reprice for 12 to 24 hours. Sometimes it never does. Our model catches that gap and quantifies it in real time. That’s the kind of idiosyncratic edge you don’t find by staring at seed numbers.
From there, with the help of Claude Code I was able to create a Discord bot that communicates the edge notifications to me on demand so that I can check them to verify and place bets accordingly. We even got it to include the injury/inefficiency edge as well!
The Halftime Edge: When Fans Panic, the Bot Buys
This is the most interesting part of the system. Kalshi keeps markets open during games. At halftime, recreational bettors overreact to the score. A strong team trailing by 8 at half might see their price crater to 15 cents, but the statistical reality says they still win 25% of the time.
The halftime scanner polls ESPN’s live scoreboard every 60 seconds, detects halftime, adjusts the pre-game probability for the score margin, and compares the adjusted price to what Kalshi is showing. A strong team trailing by 5 is a fundamentally different situation than a weak team trailing by 5. Recreational bettors don’t make that distinction. The model does.
This roughly doubles the tradeable surface area of the tournament. And the behavioral pattern is well-documented: people who bet with their hearts sell when their team is losing, regardless of what the numbers say. That’s the trade.
Position Sizing and Risk Controls
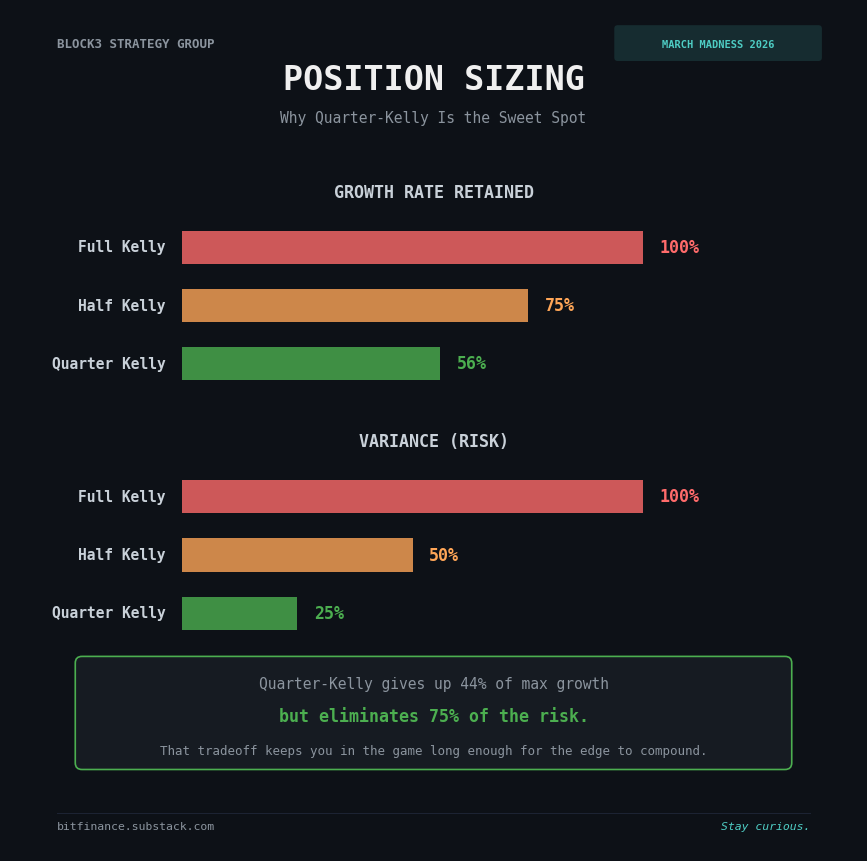
Finding an edge is the easy part. Not blowing up is the hard part. We use quarter-Kelly sizing: 25% of what the math says is optimal. That sacrifices about a quarter of theoretical returns but eliminates roughly three-quarters of the variance. For a model that’s good but not perfect, that’s the right tradeoff.
Additional guardrails: no single bet exceeds 10% of bankroll. No more than 60% of capital deployed at once. A 5-minute confirmation window before execution because edges can vanish. And a 30% drawdown kill switch that automatically pauses the bot and sends an alert. No override. No “but I think the next one will work.” The system shuts down and waits for a human.
Position sizing matters more than prediction accuracy. A 60% accurate model with disciplined sizing will outperform a 70% accurate model with reckless sizing over time. That’s true in prediction markets. It’s true in equities. It’s true everywhere.
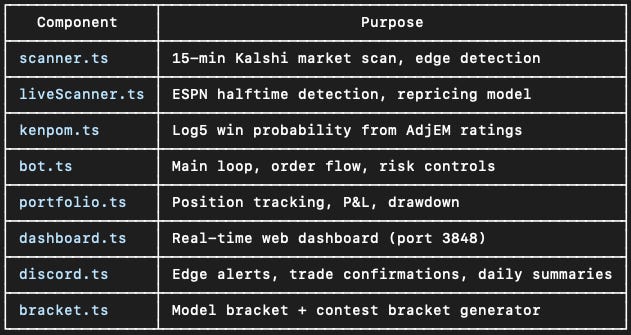
The Full Stack
Eight components: a market scanner, a halftime scanner, a KenPom probability engine, the main trading bot, a portfolio tracker, a real-time web dashboard, Discord alerts, and a bracket generator. All built with Claude Code in a weekend by someone whose coding experience six weeks ago was zero.
Here’s the part that surprised me: the edge detection logic is maybe 20% of the codebase. The other 80% is risk controls, position tracking, deduplication, alert systems, and dashboards. Finding the signal is the fun part. The plumbing that keeps you from blowing up is the real work.
What Anyone Can Take From This
The core principle transfers to any market. Any time you have a calibrated probability model and a market that lets you trade against it, you can look for pricing gaps. KenPom is public. Kalshi is public. The edge comes from systematizing the comparison, not from secret information.
Behavioral edges are real but temporary. Halftime panic-selling, earnings overreaction in equities, liquidation cascades in crypto. The pattern is the same everywhere: emotional participants create temporary mispricings, and systematic approaches capture them.
And you don’t need a PhD to build this. The entire system uses free public APIs, a well-known rating system, standard statistical methods, and a $580 bankroll. The tools to build quantitative systems are more accessible than they’ve ever been. The barrier between having a thesis and having a system that tests it has never been lower.
The Bottom Line
The tournament starts today. The bot is live and my initial placed bets are below. We’ll publish updates in Saturday’s weekly roundup. Process ? performance.
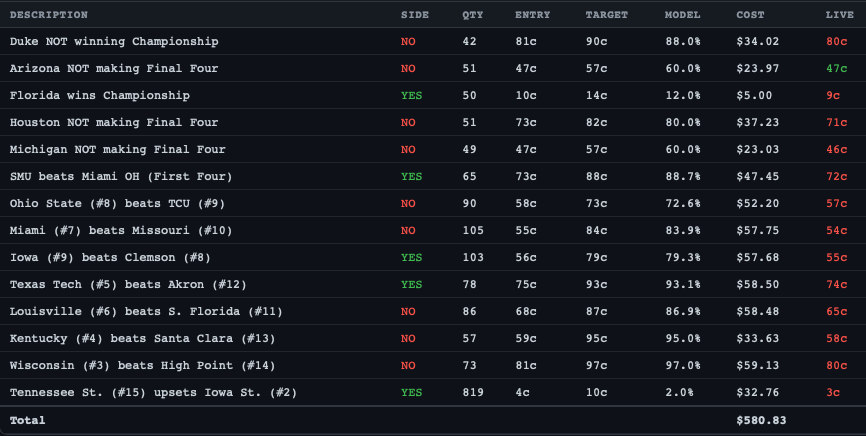
The point was never to get rich on March Madness, it was to prove that a non-technical person with domain expertise and AI tools can build a quantitative trading system in a week; time will tell if it actually works. That capability applies to prediction markets, crypto, options, and anywhere else where calibrated models meet inefficient markets.
The tools are here. The question is what you build with them.
Stay tuned!
Matthew Snider is the founder of Block3 Strategy Group, author of “Warren Buffett in a Web3 World,” and publisher of the BitFinance newsletter. He holds a Series 65 and MBA, and has been an active participant in digital asset markets since 2015. This article is for educational purposes only and should not be considered financial advice. Always consult with a qualified professional before making investment decisions.